
The focus on population limits has waned since the 70's even though the U.S. is now the world's third largest country and the world's fastest growing industrialized nation. It is imperative that Americans understand the true source of growth and be able to link the symptoms to the source.
| Advocating U.S. population stabilization necessitates a reduction in immigration levels. It is virtually mathematically impossible to be for U.S. population stabilization and against immigration reduction. With a current 1.2% growth rate in world population, which gives a doubling time of 36 years, the pressure to migrate to the U.S. will continue. |
For background on why population growth is off the national agenda, see "Forsaking Fundamentals".
The chart below shows the U.S. Census Bureau's middle-range projection of how much additional population will be forced into the United States if current immigration and fertility levels continue.
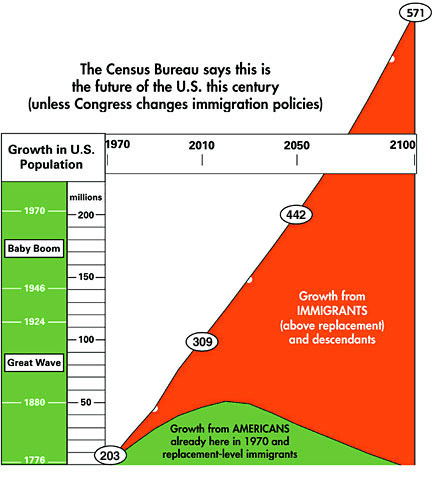
The RED BLOCK shows the phenomenal population growth being fueled by the federal government's immigration policies. The red represents all the immigrants (above the replacement level of 222,000) who have arrived -- or are projected to arrive -- since 1970, plus their descendants, minus deaths.
The GREEN BLOCK represents U.S. population growth due to the descendants of 1970-stock Americans. It assumes that these "old-stock" Americans will continue their present fertility and mortality rates. There were 203 million people living in the U.S. in 1970. Births to that population have exceeded their deaths, resulting in the growth illustrated in the green block. But the below-replacement-level fertility of "old-stock" Americans will allow this group to stabilize in size soon after the Baby Boomers' children finish having babies. (The Green Block also accounts for replacement-level immigration, which the Census Bureau currently estimates at 222,000 a year.) By the 2010 Census we reached a 308.7 million population.
Without the radical increase in the numbers of immigrants coming to the United States since 1970, U.S. population would almost be stabilized by now and would peak in 2020 at 255 million (52 million higher than in 1970). But in late 2005, we reached over 297 million.
The TOP LINE of the chart represents the actual U.S. population growth between 1970 and now, and is a projection of what the growth will be between now and the year 2050 if fertility, mortality and immigration rates remain similar to those of today. The additional 200 million people contribute to more than double the U.S. population of 1970 -- a time when most Americans believed the country already had enough congestion and sprawl.
Nearly every other advanced country in the world is moving quickly toward a stabilized population -- or already has achieved it. But Congress each year endorses immigration numbers that force the United States to deal with many of the same problems of rampant population growth that plague the world's poorest countries.
To learn how you can help change that big red block in the chart above, go to our Action page.
Updated June 2011
Source: www.NumbersUSA.com
Watch the Federation for American Immigration Reform's video "Immigration-Driven Population Growth is a Major Problem" by clicking here. |